The Truth Behind New Zealand's Electricity Emissions
28/10/2022
Data Source: Energy Link NZ 12 months emissions May 2023 Average CO2e emitted in NZ 2023 from electricity generation
Total Electricity Emissions – Emissions Intensity
All types of electricity generation, including renewables, have some environmental impact such as greenhouse gas emissions associated with the construction, operation, distribution and transmission of renewable electricity.
Below is a graph of the emissions intensity of each type of thermal electricity generation in New Zealand plus electricity sourced from Ecotricity Wind, Hydro and Solar and their embedded emissions from construction.
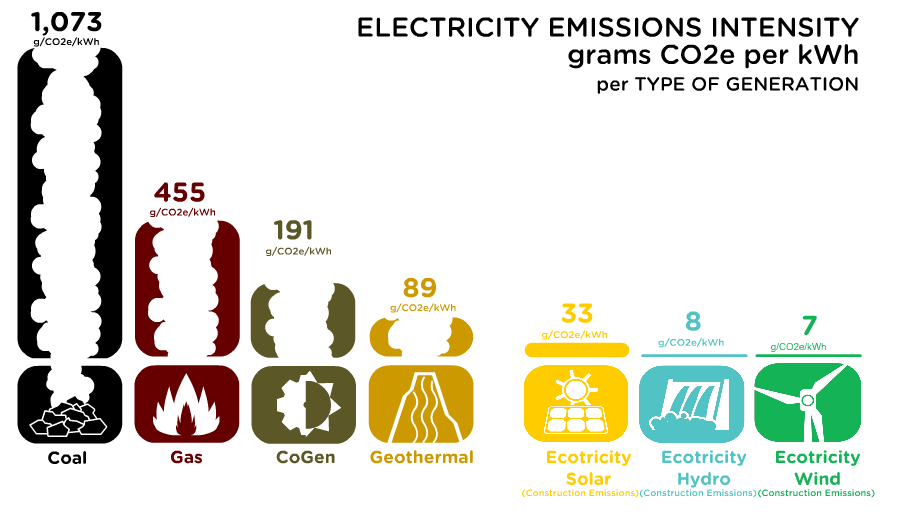
Data Source: Energy Link NZ 12 months emissions 2023
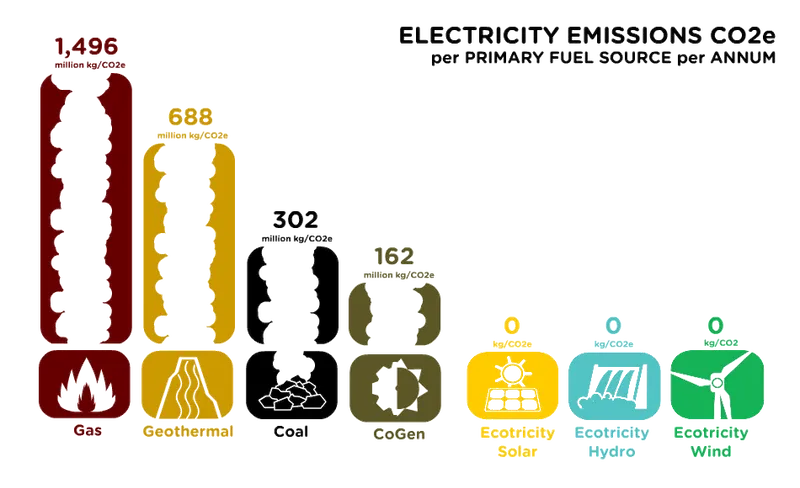
Electricity Primary Fuel Emissions
However, what’s not so flash is that over 4 billion kilograms of CO2 is still emitted from electricity in New Zealand each year.
The graph at the top of the page shows the total emissions from the primary fuel source of thermal generation from Coal, Gas and Geothermal.
That’s why we’re proud to be supplying 100% renewable and Toitū climate positive certified electricity sourced from wind, hydro and solar!
How can we guarantee that our customers only get our climate positive electricity to their homes and businesses?
The short answer is we can’t measure every electron. As mentioned above, all electricity goes into and out of the national grid.
However, because electricity is an interchangeable commodity throughout New Zealand, we are very accurately able to account for how much energy our customers are using and conversely how much we need to purchase from climate positive certified, renewable resources on an annualized basis. The net effect therefore, is that over the course of a 12 month period we are only supplying from certified renewable sources and do not need to tap into ‘dirty’ sources to fill in the gaps.
So, if we can’t guarantee you will receive our climate positive power, why should you join us?
To help save the planet and reverse the impacts from the climate crisis!
It’s more important to focus on the generation side to help get New Zealand’s electricity grid to 100% renewable. Our certification is based on international protocols and United Nations Product Specifications for supplying electricity from renewable sources. The reason it is important to support climate positive certified electricity is so that new renewable electricity is developed, in particular wind and solar, so by choosing Ecotricity you are encouraging more electricity generation through sustainable means. It’s a no brainer!
We're leading the industry by going above and beyond to map out sustainable processes up and down the value chain. As a company we are committed to making New Zealand's electricity grid 100% renewable by actively promoting the development of solar farms, wind farms and residential solar to replace reliance on fossil fuels. Not only does this lower our overall carbon emissions, this will also bring down the cost of electricity.
Energy Emissions – Since 1990
Between 1990 and 2017 New Zealand’s emissions from electricity have risen 17%. The good news is that both electricity and transport emissions can be brought down rapidly, by moving to 100% Renewables and Electric Vehicles …… and will cost a lot less for Kiwi’s and Kiwi businesses.
Electricity Emissions – Preceding 12 Months
The following graph shows the amount of CO2e emitted per kWh of electricity, on a monthly basis.
This is calculated on national average electricity CO2e intensity per kWh. This changes from year to year, and depends greatly on the amount of rainfall in hydro dam catchments. As you can see, we are tracking well with the lowest figures since 2014.
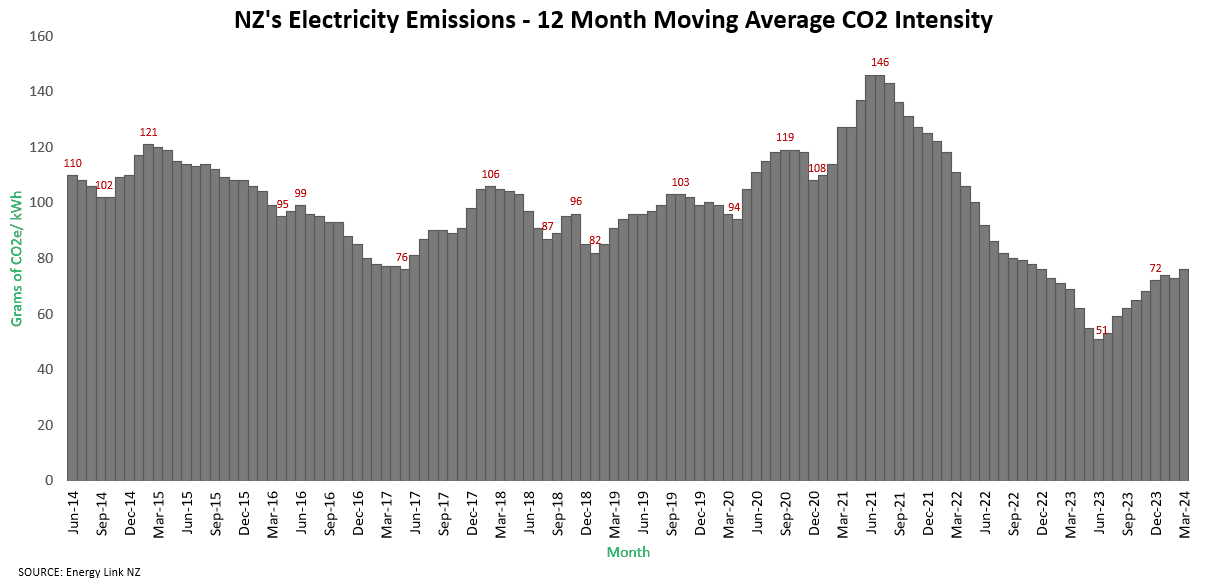
More information can be found at the Ministry for the Environment Interactive website here (Computer browsers only).
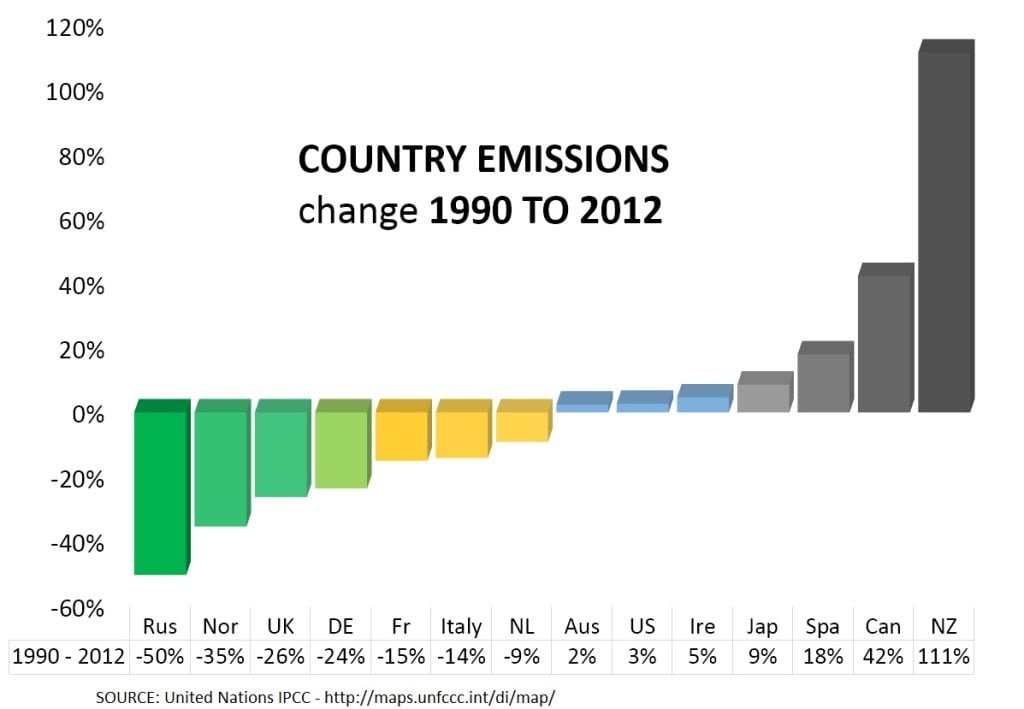
NZ Emissions Change – 1990 To 2012
We are a small country but our carbon equivalent footprint per capita is still significant. Our greenhouse gas emissions have grown substantially. If we look at our greenhouse gas emissions on a per capita basis, a person in New Zealand accounts for nearly twice the amount of emissions than a person in the UK and more than seven times the amount of a person in India.
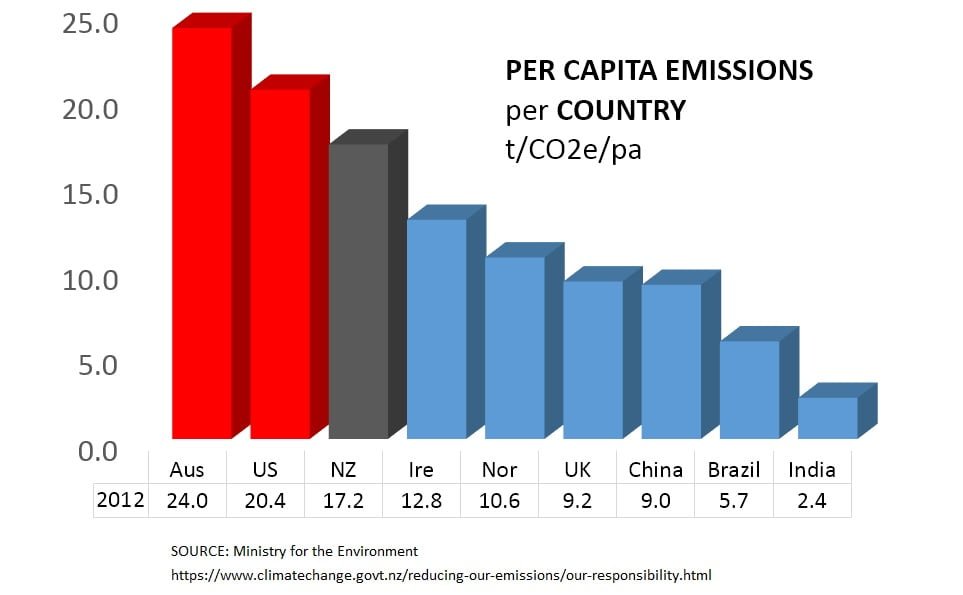
The following graph shows New Zealand's greenhouse gas emissions change from 1990 to 2012 compared to other countries that are part of the Kyoto Protocol. This includes all gases, all industries and all land use changes.
New Zealand emissions have increased 111% since 1990. Other countries that have exceeded New Zealand's emissions growth include China (260%) and Turkey (163%). Data is sourced from the United Nations – International Panel for Climate Change site.